
Spectral reflectance data is captured by illuminating a material with a light source and recording the reflected light with a spectrometer or hyperspectral line scan camera. The collected data can provide information on the mineralogy because certain minerals absorb light at specific wavelengths. The processes through which these absorptions take place vary between the different regions of the electromagnetic spectrum. Only a limited set of minerals can be detected on each of these regions because the absorption processes require a specific molecular configuration of the mineral. The table below presents an overview of how well different types of minerals can be identified with spectral reflectance measurements on the VIS-NIR, SWIR and LWIR spectral ranges. The MWIR spectral range is not included in this table because reflection spectroscopy applications for minerals is relatively unexplored on this spectral range.
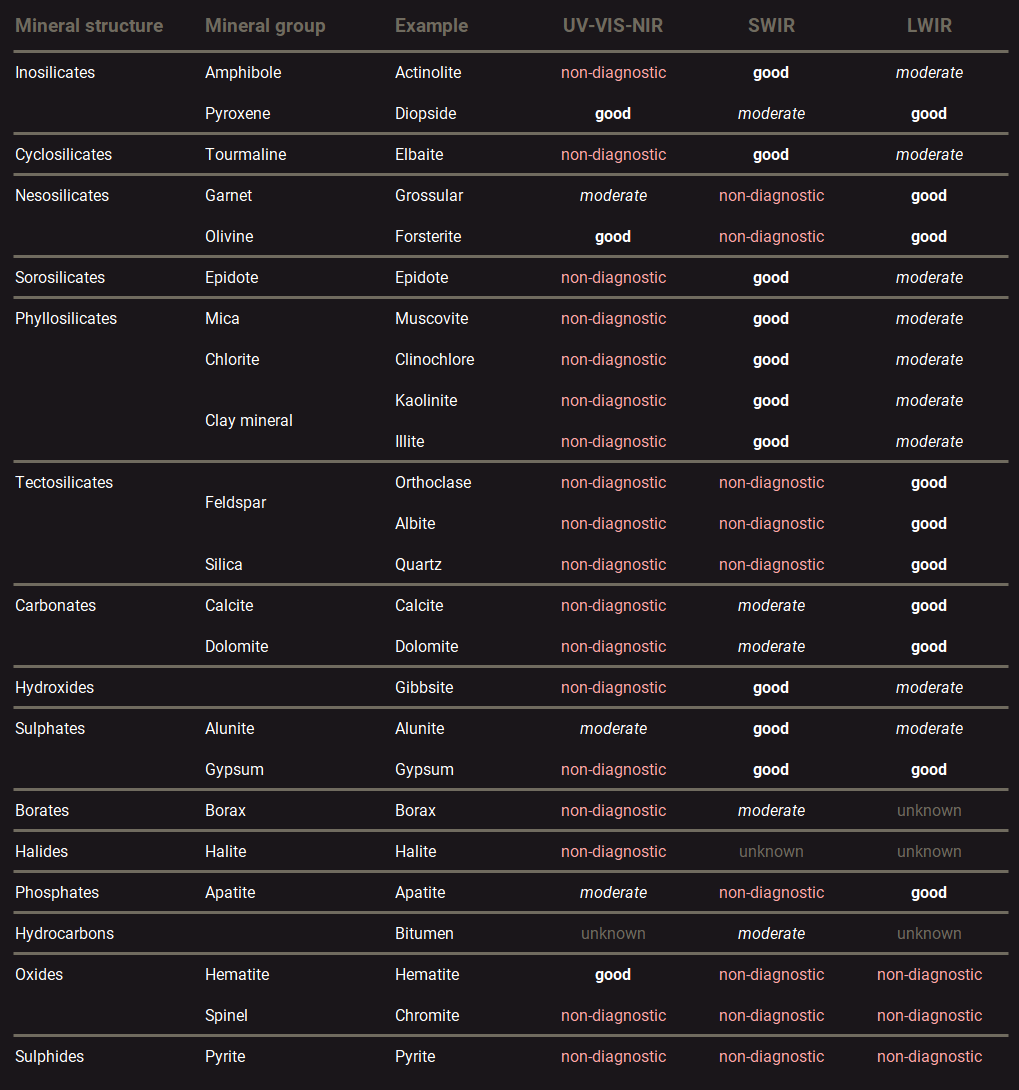
Overview of the minerals that can be detected with reflectance spectroscopy on the different spectral ranges1.
Spectral reflectance sensors are useful tools for mapping the geology of ore deposits2,3. This is especially the case for hydrothermal deposit types. At these deposits, ore minerals originate from hot watery fluids that are produced by some sort of volcanic activity. Ore minerals are deposited from the fluids because the pressure and temperature changes when it travels to the surface and fractures the rocks. This mineralisation is often associated with chemical alteration of the minerals that were originally in the rocks. Some infrared reflectance sensors are extremely sensitive to the chemical changes within these minerals and are therefore useful for identifying different mineralisation zones and structures. Even though many ore minerals can not be detected with spectral reflectance sensors, detection of these altered minerals can often be used to distinguish different ore types and ranges of ore grade (waste/low/high). The table below presents an overview of different environments of ore deposit formation and the characteristic mineral assemblages that can be detected with spectral reflectance sensors.
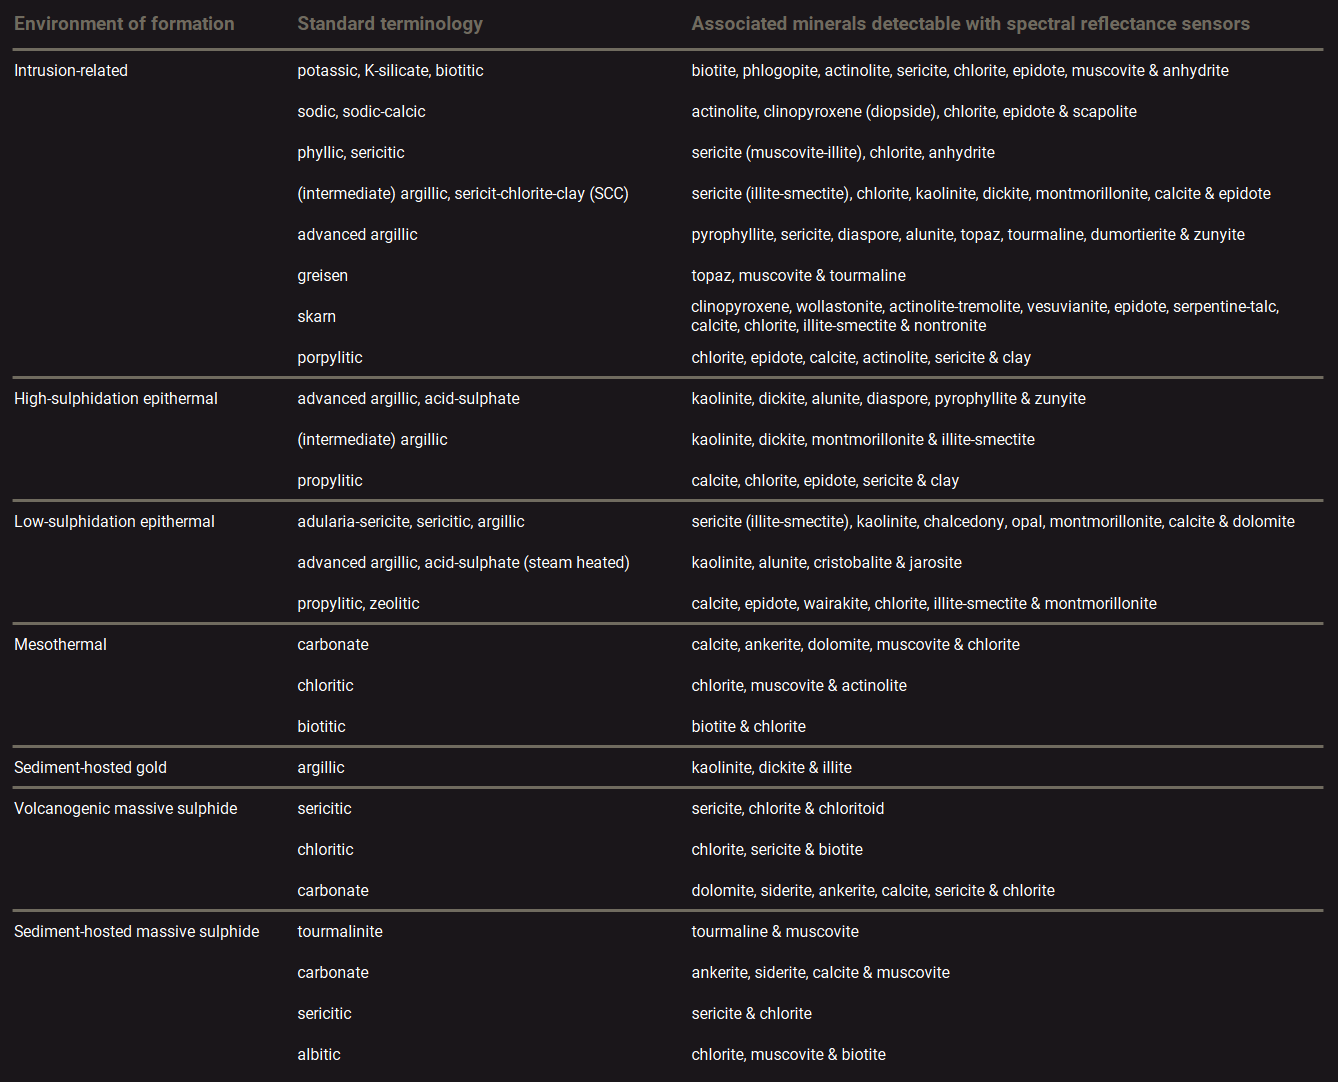
Characteristic mineral assemblages at different environments of ore deposit formation.
source: PhD thesis M.Dalm (2018 – TU Delft), https://doi.org/10.4233/uuid:70a1e180-ef0c-4226-9af3-7e9dc3938c7f
For applications in hydrothermal deposit mining, an additional calibration step of the reflectance sensors is needed to link the detection of altered minerals to ore grade. This requires measurement of a set of samples that covers the mineralogical variability of the deposit. A large number of samples (> 1000) is often needed in order to use AI and machine learning to unravel any indirect relationships. Drill core scanning is considered to be useful for this because drill core samples are often already collected with the aim of covering geological variability. This can also serve two purposes since the drill core scans can be used to improve deposit models and simultaneously reveal opportunities for scanning applications during mine operation.
Working principle
Reflectance spectroscopy is performed by illuminating a material with a light source and collecting the reflected light with an optical system. A spectrometer or hyperspectral line scan camera is used to measure the reflected light intensity at different wavelengths. Certain minerals can be identified by analysing the intensity and wavelength of absorption features in the recorded spectra.
The physical processes through which absorptions take place differ between the different spectral regions. The table below shows an overview of these processes for each region.
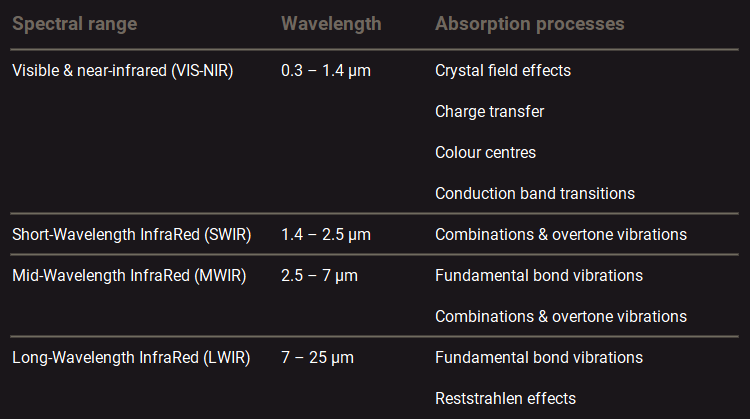
Main mineral absorption processes at different spectral regions.
Visible (VIS) and near-infrared (NIR)
In the VIS-NIR spectral range (0.3 – 1.4 µm) minerals can absorb light through various physical processes. These include crystal field effects, charge transfer, colour centres, and conduction band transitions4,5.
The absorption mechanism that is most often observed in the VIS-NIR spectra of minerals is the crystal field effect4. Crystal field effects are absorptions of light by electrons that change between the orbital energy levels of transition metal complexes. Transition metal complexes are molecules consisting of a transition metal and a ligand. See this article on Libretexts chemistry for more info.
The wavelength of crystal field absorptions is related to the energy difference between the orbitals. This energy difference mainly depends on the type of transition metal and ligand that form the complex4. This means that the wavelength of absorption depends on the mineral in which the transition metal occurs. Transition metals for which absorptions due to crystal field effects are often observed include Fe, Ni, Cu, Mn, Cr and Ti5.
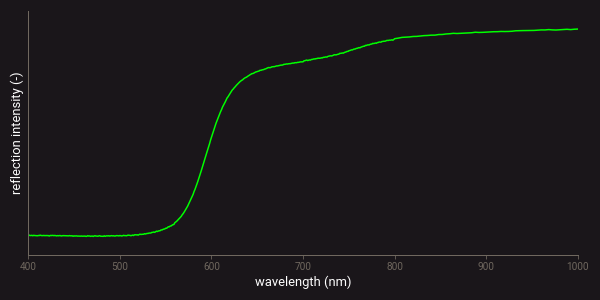
Charge transfer is the migration of electrons between neighbouring ions or between ions and ligands4,5. This can also occur between neighbouring ions of transition metals in different valence states, such as Fe2+ and Fe3+. The wavelength of absorption depends on the energy that is required for the charge transfer. Charge transfer absorptions are commonly seen in the reflectance spectra of iron oxides. As an example, the figure below presents the VIS-NIR spectrum of the iron-oxide mineral goethite. The reflectance drop-off towards 500 nm in this spectrum is produced by charge transfer absorption. The absorption features that occur around 650 and 900 nm are caused by electronic transitions.
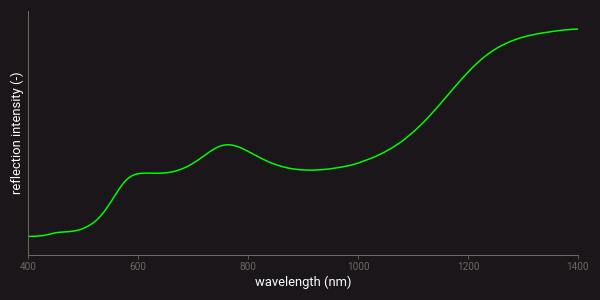
Example of a VIS-NIR spectrum of goethite.
Another type of absorption that is produced by certain minerals are colour centres. As with crystal field effects, colour centres are also absorptions produced by electrons that change between energy levels. However, in this case this results from a defect in the crystal structure of the mineral. For more information on crystals and crystallography, see this article on Libretexts chemistry.
Two types of colour centres can be distinguished. The first type is due to a vacancy defect in which an electron can reside at different discrete energy levels5,6. This is referred to as an electron colour centre. An example of a mineral for which an electron colour centre is often observed is fluorite. The other type of colour centre is referred to as a hole colour centre and is produced when an electron is missing from a location where there is normally an electron pair6. This can be caused by the presence of an impurity ion. A hole colour centre is for example responsible for the colour of smoky quartz.
Absorptions from conduction band transitions can often be observed in the VIS-NIR spectra of semiconductor minerals, such as many types of sulphides7. In these minerals electrons can be attached to individual atoms, known as the valence band, or they can move freely through the lattice, known as the conduction band4,5. The energy difference between these two bands is known as the band gap. Electrons can transfer from the valence band to the conduction band by absorbing light with energies larger than the band gap5. This produces a step function in the VIS-NIR spectra of these minerals. The wavelength location of the step depends on the mineral in which the conduction band transition takes place. Examples of minerals for which such absorptions are observed include realgar, stibnite, and native sulphur5. An example of a VIS-NIR spectrum of realgar is presented below.
Example of a VIS-NIR spectrum of realgar.
Mid-wavelength infrared (MWIR)
In the MWIR spectral range minerals absorb light through molecule bond vibrations. The light’s energy in the form of photons is transferred into an increased vibrational energy level of a molecule bond. This is related to changes in the dipole moment of the molecule8,9 (see this article on Libretexts chemistry for more info on dipoles). The wavelength at which the light is absorbed depends on the energy that is associated with the change in dipole moment. No absorption takes place if the vibrating molecule bonds do not change the dipole moment of the mineral.
Molecule bonds vibrate by stretching of the bond or by bending of the angle of the bond. In polyatomic molecules, multiple bonds vibrate at the same time and produce different types of group vibrations9. This article on Libretexts chemistry shows an overview of the different group vibrations.
The molecule bond vibrations can also be excited with two or more energy quanta, producing so-called overtones of the fundamental vibrational modes. Additionally, two or more fundamentals and/or overtones of different modes can add or subtract to form so-called combinations4,9. Minerals and mineral characteristics can be identified from the wavelength position and intensity of a specific combination of absorption features resulting from the fundamental, overtone and combinations of molecule bond vibrations. The figure below presents an example of a measured MWIR spectrum on a quartz sample. It clearly shows the absorption features from molecule bond vibrations as minima on the spectral profile.
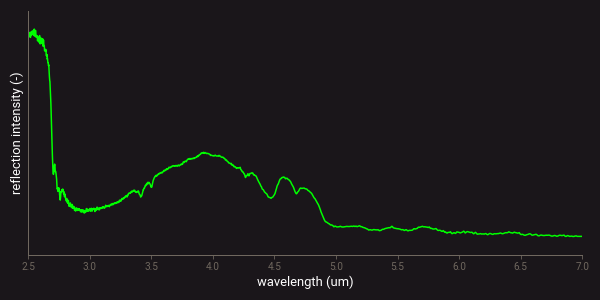
Example of a MWIR spectrum of quartz.
Short-wavelength infrared (SWIR)
Mineral absorptions features in the SWIR range have a similar origin as those in the MWIR. However, no fundamental vibrational absorptions occur in the SWIR. Absorption bands in this range are all overtones and combinations10. Relatively high fundamental absorption frequencies are required though to produce diagnostic overtones and combinations in the SWIR range. These are only produced by molecule bonds between atoms with a large difference in atomic number. SWIR reflectance spectroscopy is therefore largely restricted to minerals with OH, CO3, SO4 and NH3 groups10,11. Especially overtone combinations involving Al-OH, Fe-OH and Mg-OH bonds are often characteristic for specific minerals and variations in their composition.
The occurrence of water also produces absorption features in the SWIR. This water can be physically adsorbed on the surface of mineral grains, it can occupy specific lattice sites or it can be part of the crystal structure12. The figure below presents an example of the SWIR spectra of several minerals on which the wavelength ranges at which the most diagnostic molecule bond vibrations are indicated. Since not all molecule bonds are diagnostic in the SWIR spectral region, the use of SWIR spectrometry is generally limited to the following groups of minerals; phyllosilicates, hydroxylated silicates, sulphates, carbonates and ammonium-bearing minerals11.
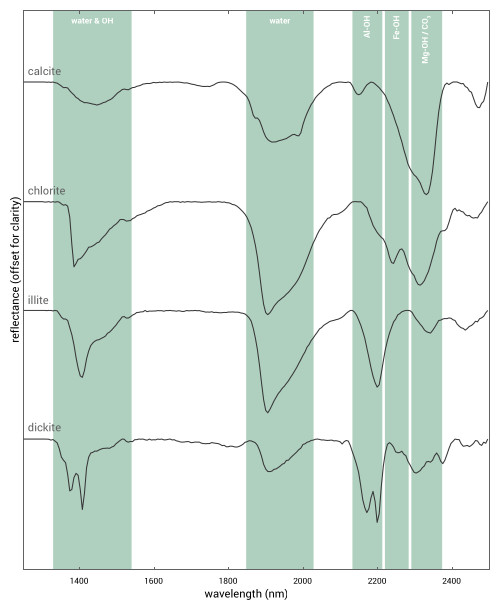
Example of mineral mapping with SWIR hyperspectral imaging.
source: PhD thesis M.Dalm (2018 – TU Delft), https://doi.org/10.4233/uuid:70a1e180-ef0c-4226-9af3-7e9dc3938c7f
Long-wavelength infrared (LWIR)
The reflectance of minerals on the LWIR spectral range is usually dominated by reflectance peaks that are referred to as reststrahlen features or reststrahlen bands. Reststrahlen features result from fundamental molecule bond vibrations that change a material’s refractive index and extinction coefficient over a specific wavelength range4. This produces a relatively high reflection at these wavelengths. Because of the relationship to molecule bond vibrations, reststrahlen features can be used to determine mineralogical composition. However, the intensity and shape of these features is also influenced by grain size13.
The figure below presents an example of the MWIR-LWIR diffuse reflectance spectrum of a quartz sample. The reflectance peaks around 8-10 µm and 12-13 µm are the reststrahlen features of the Si–O stretching vibrations of quartz.

Example of a LWIR spectrum of quartz.
In the MWIR-LWIR region of the electromagnetic spectrum materials also emit black-body radiation. The intensity of the radiation that is emitted is related to the temperature of the material by Planck’s law. Temperature differences can influence the MWIR-LWIR reflectance spectra that are measured.
General characteristics
Reflectance spectrometry is a surface technique. Point measurements on the VIS-NIR-SWIR ranges with a laboratory or handheld instrument at a reasonable signal-to-noise ratio can be acquired within a millisecond. On the MWIR-LWIR Fourier-transform spectrometers are most often used. The measurement time with these instruments is around 30 seconds. It is also possible to use dispersive spectrometers for this spectral range and reduce measurement time, but the quality of the spectra in terms of signal-to-noise ratio is usually also lower in this case.
The spot size of point spectrometers is usually around several square centimetres. However, any spot size is theoretically possible by configuring the collection optics of the measurement system.
Using a line scan sensor to collect hyperspectral imagery data is currently possible up to around 800 fps on the VIS-NIR range, 450 fps on the SWIR range, 370 fps on the MWIR range, and 240 fps on the LWIR range15,16. However, the frame rate is also related to spectral resolution, spatial resolution and the signal-to-noise ratio. Customization of the optical collection system is possible to obtain a higher frame rates with lower resolution or signal-to-noise for example. Additionally, it should be noted that hyperspectral imagery data on the MWIR and LWIR range is usually of much lower quality in terms of signal-to-noise than point spectra obtained with a Fourier-transform spectrometer.
Reflectance measurements require a light source to illuminate the materials. In earth observation spectroscopy and large area scans, sunlight is usually the only available source. However, the intensity and spectral profile of the sunlight is not constant, which means corrections are needed during the data analysis that may affect measurement accuracy. In applications such as drill core and conveyor belt scanning, halogen lamps are most often used for illumination.
Contrast
Reflectance spectra on the VIS-NIR region are mainly a spectral representation of a mineral or rock’s colour. The contrast of VIS-NIR sensor applications therefore largely depends on the visible differences between the minerals and rocks that are analysed. Additionally, some minerals produce unique and distinct absorption features that can be used to measure mineral quantity and composition. Since the features on the VIS-NIR range are relatively broad, overlap often occurs when mineral mixtures are analysed.
Absorption features on the SWIR and MWIR range are more narrow and distinct than those on the VIS-NIR. However, the features of different minerals often still overlap and limit the detection capabilities of minerals occurring in low quantities.
The reststrahlen features of different minerals in the LWIR have lots of overlap. Unmixing these features into different minerals is therefore difficult. This is easier if the spot or pixel size of the reflectance measurements is small in relation to the crystal or grain size of minerals in the rock because pure mineral components are more frequently measured in that case.
Detection limits
There are many minerals that produce no unique absorption features that can be used to identify them. These minerals can sometimes still be distinguished from each other by using differences in colour or overall spectral profile, but information on their occurrence needs to be provided by some other analytical method. Detection limit does not apply to these minerals (or is 100%), since they cannot be identified with spectral reflectance sensors at all.
Detection limits only concern minerals with distinct absorption features that occur in a mineral mixture. The detection limit in this case is the surface area coverage at which the mineral’s features can still be observed in the measured spectrum.
The detection limit mainly depends on the overall reflectivity of a rock or mineral. Detection limits are higher on dark rocks because less light is reflected, which reduces the signal-to-noise of the recorded spectrum. A higher amount of noise conceals the mineral absorption features at lower concentrations.
Matrix effects
Spectral reflectance measurements are affected by physical matrix effects such as differences in surface roughness or crystallinity. The impact of chemical matrix effects largely depends on the size distribution of the minerals within the rock and the spot size or pixel size of the measurements. Chemical matrix effects occur due to spectral mixing between different compounds and therefore do not apply when the spot size covers only a single mineral.
If multiple minerals are measured, the spectrum is a combination of the absorption profiles of each mineral. Certain minerals produce more intense absorption features than others, and the absorption intensity is not linearly related to concentration in terms of area coverage. The intensity of a mineral’s absorption profile can also change if it is in a 50-50 mixture and the other mineral is replaced by a different one. This is especially the case if the other mineral was white and transparent, and is replaced by a dark and opaque one.
Safety
Reflectance spectroscopy on the visible and infrared spectral ranges does not involve any hazardous radiation and analyser equipment can generally be used without any additional safety measures. Only when very bright lamps are used as a light source, protective goggles may be required to prevent eye damage.
Further reading
The related books section of the RockDataAcademy provides several references to books with more information on spectroscopy and hyperspectral imaging. Especially the first chapter of the manual of remote sensing provides useful descriptions of reflectance spectroscopy applications for rocks and minerals. This chapter is freely available from the website of the Hawai institute of geophysics and planetology (link).
The chapter on “spectroscopy” within the open-access library of Libretexts chemistry also provides a good introduction that can be accessed for free.
Spectral libraries
Both commercial and open-access libraries with referenced mineral spectra are available that can be used for mineral identification from spectral reflectance measurements. The following online libraries can be accessed for free:
Additionally, the ECOSTRESS spectral library can be freely accessed to view mineral spectra, but payment is needed to download data. The number of views per day is also restricted.
Mineral reference spectra that can be used to analyse reflectance sensor measurements are also published in literature. Publications that are considered to be particularly useful are the following:
- “Visible and near infrared spectra of minerals and rocks” by Hunt & Salisbury (1970, Modern geology)
- “High spectral resolution reflectance spectroscopy of minerals” by Clark et al. (1990, Journal of geophysical research).
- “G-MEX spectral interpretation field manual” by AusSpec (2008, AusSpec international ltd.)
Finally, commercial software is available for automated analysis of mineral reflectance spectra. Mineral identification with such software is usually based on an integrated spectral library. Some of the libraries mentioned above are usually included with the software.
References
- Terracore. How GeoSpectral Imaging works. http://terracoregeo.com/how-geospectral-imaging-works/ (2024).
- Hunt, G. R. Near-infrared (1.3–2.4) μm spectra of alteration minerals—Potential for use in remote sensing. Geophysics 44, 1974–1986 (1979).
- Thompson, A. J., Hauff, P. L. & Robitaille, A. J. Alteration mapping in exploration: application of short-wave infrared (SWIR) spectroscopy. SEG newsletter 39, 16–27 (1999).
- Clark, R. N. Spectroscopy of rocks and minerals, and principles of spectroscopy. Manual of remote sensing 3, 3–58 (1999).
- Hunt, G. R. Spectral signatures of particulate minerals in the visible and near infrared. Geophysics 42, 501–513 (1977).
- Nassau, K. The origins of colour in minerals. American Mineralogist 63, 219 (1978).
- Boldish, S. I. & White, W. B. Optical band gaps of selected ternary sulfide minerals. (1998).
- Farmer, V. C. Infrared Spectra of Minerals. (Mineralogical society, 1974).
- Hollas, J. M. Modern Spectroscopy. (John Wiley & Sons, West Sussex, England, 2004).
- Hunt, G. R. Visible and near-infrared spectra of minerals and rocks: I silicate minerals. Modern geology 1, 283–300 (1970).
- AusSpec. G-MEX Spectral Interpretation Field Manual. (AusSpec International ltd., 2008).
- Clark, R. N., King, T. V., Klejwa, M., Swayze, G. A. & Vergo, N. High spectral resolution reflectance spectroscopy of minerals. Journal of Geophysical Research: Solid Earth 95, 12653–12680 (1990).
- Salisbury, J. W. & Wald, A. The role of volume scattering in reducing spectral contrast of reststrahlen bands in spectra of powdered minerals. Icarus 96, 121–128 (1992).
- Hapke, B. Theory of Reflectance and Emittance Spectroscopy. (Cambridge University Press, Cambridge, UK ;, 2012).
- Specim. Hyperspectral cameras and imagers. https://www.specim.com/hyperspectral-cameras/ (2024).
- HySpex. HySpex cameras (online). https://www.hyspex.com/hyspex-products/ (2024).