
The performance of sensor systems for detecting the concentration of an element or mineral can be described in terms of accuracy, trueness, and precision. These concepts are illustrated in the figure below. Trueness refers to how close the measurements are to their true value, and precision to how close measurements on the same sample are to each other. Accuracy is the combination of the two, and provides an indication of the analytical performance of the sensor. Additionally, the term bias is sometimes used to indicate how far measurements are from their true value. Bias and trueness describe the same phenomenon, but are inversely proportional to each other.
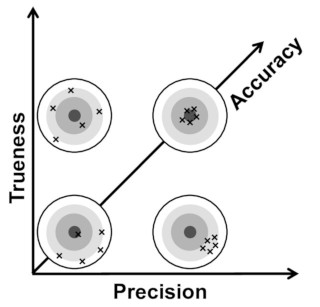
Accuracy, precision & trueness.
Source: Caruso et al. (2017). ICP-OES method for the characterization of cement pore solutions and their modification by polycarboxylate-based superplasticizers. Cement and Concrete Research, 91: 52-60.
Determining a sensor’s accuracy is usually based on the analysis of samples of which the composition is also measured with another method. These other methods generally involve crushing, pulverizing, and homogenizing the sample followed by a preparation method such as acid leaching, glass fusion, or fire assay. Finally, the prepared sample is measured with an established laboratory technique such as inductively coupled plasma (ICP), x-ray fluorescence (XRF), or atomic absorption spectroscopy (AAS) spectroscopy.
For a reliable evaluation of sensor performance it is important that the determination of accuracy is done on samples from the mine where a sensor system is (to be) installed. This is because the measurements of all sensor types are in some way affected by variations in rock composition. With the established laboratory techniques these effects are largely eliminated through sample preparation. However, real-time analysers and sorters require measurements without sample preparation. The differences in rock composition that will pass the sensor therefore need to be accounted for through some sort of calibration. These calibrations should be based on all the different rock types and compositional variations that occur at a deposit in order to guarantee that the sensor’s accuracy is valid for all the ore that is analysed.
The actual accuracy of an analyser taking on-line measurements in a mining process is often not known due to a lack of information about the material that is analysed. This is because thorough sampling is required to properly evaluate the “true” composition of large and heterogeneous ore volumes, which is generally time consuming and expensive. In some cases, it may be possible to link sensor measurements to mine production results for reconciliation and tuning of the sensor’s calibration.
To evaluate potential sensor performance for a specific mine without testing for accuracy and precision, other general sensor characteristics can be used. Examples of other characteristics are the following:
- Interrogation type
- Contrast
- Detection limit
- Matrix effects
- Data acquisition speed
Interrogation type
The interrogation type refers to how the ore material is measured and what kind of data is recorded. Most solid materials interact heavily with electromagnetic radiation on the range from low energy x-rays up to microwave radiation. Because of this, the radiation on these wavelengths cannot penetrate most rocks more than a few mm. Sensors that operate in this wavelength range can therefore only be used to characterise the surface of a material. Gamma-rays, high energy x-rays, microwaves and radio waves are forms of electromagnetic radiation that are able to penetrate solid materials. Sensor operating in these regions can therefore be used to characterise a volume. However, this is restricted to a certain maximum since materials do absorb some of the radiation travelling through it.
The type of sensor recording can be a single point measurement or some sort of image. A point measurement yields a single result that represents the surface or volume of a material at the location where the measurement is taken. An important parameter of point measurements is the size of the surface area that is measured, which is commonly referred to as the spot size.
A point measurement can represent a single surface or a moving average. In a moving average the material that is exposed to the sensor is changing while taking the measurement. This is a common method for sensors for which relatively long measurement times are required to obtain an acceptable signal-to-noise ratio and sensor precision. An example of such a sensor is PGNAA. In a PGNAA conveyor belt scanner, the sensor continuously measures the material on the conveyor belt and produces a moving average every minute or so.
A well-known example of image data is a digital photograph, which is in fact a representation of reflected light in the red, green and blue (RGB) regions of the visible part of the electromagnetic spectrum. Other examples are x-ray transmission images or infrared (hyperspectral) images. An important parameter of image data is the spatial resolution of the image. Spatial resolution is the number of data points or pixels per unit of surface area.
Contrast
Contrast refers to how well a certain material property can be distinguished from other features that appear in the measured sensor signal. For a regular camera this means how well the colour of a certain material class can be distinguished from the colour of other classes (eg. ore vs waste, high- vs low-grade, oxide vs sulphide, etc.). For sensors based on spectroscopy, contrast refers to how well the spectral signature of an element or mineral of interest can be distinguished from those of other elements. The spectral signatures of different elements sometimes overlaps, which means that contrast can be affected by the presence of other components in the ore. Because of this, measurement of arsenic with an x-ray fluorescence (XRF) sensor for example can be problematic when the ore has relatively high lead contents. Another example is the laser-induced breakdown spectroscopy (LIBS) sensor for which high iron contents can obscure the signatures of many other elements.
Detection limit
The detection limit is the lowest concentration of a mineral or element that can be measured with a sensor. Detection limits depend on the sensing technique as well as the hardware configuration that is used to perform the measurements. Detection limits can therefore differ between sensor systems that are based on the same working principles. Additionally, the detection limit is usually not the same for all elements or minerals and can sometimes also be affected by other material properties. In short-wavelength infrared (SWIR) reflectance spectroscopy for example, the detection limit mainly depends on the overall reflectivity of a rock. Detection limits are usually higher on dark rocks because less light is reflected, which reduces the signal-to-noise of the recorded spectrum. A higher noise contribution conceals the mineral absorptions at lower concentrations. This shows that detection limit and contrast are also related to each other.
When measuring ores and rocks, the detection limit is often affected by the spot size on which measurements are performed. This is because rocks are composed of different minerals with varying crystal or grain sizes. Depending on the size and distribution of the individual minerals, it is possible that elevated concentrations occur within a certain spots. This is especially the case when the measured spot size is small (e.g. several millimetres in diameter). It means that very low concentrations can sometimes be detected by taking a very high number of measurements at small spots throughout the surface of a rock or ore pile.
Matrix effects
The matrix effect is a phenomenon in which the measured signal of a certain mineral or element is influenced by the measurement process and other components within the material. All sensor technologies suffer from matrix effects to some degree. However, the probability that matrix effects occur is higher for certain types of sensors than others. This is related to the physical working principles of the sensor and the number of factors that can produce a matrix effect.
Matrix effects can be sub-divided into physical and chemical effects. Physical effects are produced by the measurement process and differences in the physical characteristics of samples such as grain size distribution, hardness, density, and surface roughness. Laser-induced breakdown spectroscopy (LIBS) is an example of a sensor type where physical matrix effects can have a significant impact. This technique relies on a plasma that is generated by shooting a focused laser pulse on the surface of a sample. Variations in the angle, surface roughness and hardness at the spot where the laser pulse hits the rock changes the way in which the plasma is formed and influences the spectrum that is recorded.
Chemical matrix effects are those where the measured signal of a certain element with a fixed concentration becomes different when the concentration of other elements changes. In x-ray fluorescence (XRF) for example the signal intensity of 1% copper is different when the copper is within a mixture of oxide minerals than when it is in a mixture of sulphide minerals. This is related to differences in the amount of x-ray re-absorption by these minerals. Such chemical matrix effects occur for almost all sensor technologies.
Matrix effects can be largely eliminated through proper calibration of the algorithms that convert raw sensor data to element or mineral concentration. Such calibrations should be based on a set of samples that cover the variety in rock type and composition that occurs at a certain deposit. When the risk of matrix effects for a certain sensor technology is high, a more extensive calibration is likely needed to produce reliable results.
Data acquisition speed
The data acquisition speed is the time period that is typically required to collect a single measurement, an entire image, or a line of a line scan. For line scan and imaging sensors, the data acquisition speed is often expressed as a frame rate, which represents the number of lines or frames that are acquired per second (fps).
Data acquisition speed is usually closely related to spectrometer signal-to-noise. The speed of a measurement can often be increased by reducing the exposure of the recording spectrometer. However, reducing the exposure decreases the signal-to-noise ratio and precision of the measurement. This means that the quality of the results that the sensor produces is lower.
The same applies to the averaging of multiple measurements. Even though a single measurement can sometimes be collected rapidly, multiple measurements may be needed to determine an ore’s composition due to spot size restrictions. Including a higher number of measurements in calculating an average increases the accuracy and precision of the obtained result, but it will take more time to collect the data.