
Laser-induced breakdown spectroscopy (LIBS) is an analytical technique that can be used to detect a material’s chemical composition. It is performed by using a high-energy pulsed laser to create a plasma on the surface of a material. Measuring the light emissions from the plasma with a spectrometer reveals the quantity of the chemical elements within it.
LIBS sensor applications in mining are mainly handheld analysers and scanners for drill cores and conveyor belts. Most manufacturers of LIBS equipment offer customized solutions, and only a few off-the-shelf systems are available.
The configuration of LIBS systems is highly variable due to the large number of lasers with different performance characteristics that are available on the market. This is largely because the same lasers are also used in many other industries for cutting, welding, and engraving. Performance of the laser affects the properties of the plasma that is created, which has an impact on the detection capabilities of the LIBS system1. The laser is usually the most expensive component of a LIBS system, and the laser performance therefore often drives the cost of a LIBS analyser.
Working principle
The plasmas that are used in LIBS are produced by focusing a pulsed laser beam on a small area on the surface of a material (typically 0.1 mm in diameter). Due to the high energy in the laser pulse, the material at that surface area heats up to around 10 000 to 15 000 degrees Celsius and forms a plasma. Within the plasma, all the molecule bonds are broken and the individual atoms become free and ionized. This means that some of the electrons that are orbiting the core of an atom are released from their orbit and fly freely through the plasma. When the plasma cools down, these electrons fall back into the atomic orbits and emit light in the form of photons. The energy and wavelength of this emission is characteristic for the atom and the specific electron orbit. Chemical composition is determined by recording the emission spectrum and converting it to element concentrations by using some kind of calibration. The figure below shows an example of a LIBS spectrum measured on a gold ore particle.
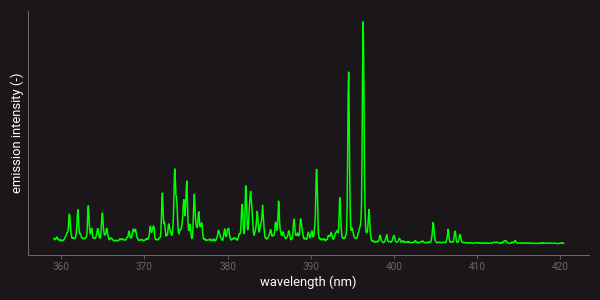
Example of a LIBS spectrum measured on a gold ore particle.
A single LIBS measurement is usually not sufficient to determine the composition of ores and rocks. This is because most rocks are heterogenous mixtures of different minerals with various crystal or grain sizes, and the spot size of a LIBS measurement is usually too small to cover all the variety. The number of measurements that is needed depends on the heterogeneity of the ore, the required accuracy of the analysis, and the concentration range of the elements or minerals of interest.
The whole LIBS process of plasma creation, cool down, and measurement of the emissions takes only several microseconds1. This means that LIBS measurements are very fast. Depending on the type of laser that is used, LIBS measurements can also be performed at relatively high repetition rates. LIBS scanners with measurement speeds up to 1 000 Hz are currently available2.
Unlike the LIF and XRL techniques, LIBS is not affected by any molecular emission processes. This is because the high plasma temperature destroyed all the molecule bonds. The emissions that are measured with LIBS only reflect chemical composition in a way that is similar to XRF. However, the emissions in LIBS are from transitions of the outer-shell electrons, while XRF measures inner-shell electron transitions (orbiting closer to the core of the atom). Due to the energy difference between these transitions, LIBS emissions are measured on the VIS-NIR spectral range, while XRF measures an x-ray spectrum.
General characteristics
LIBS measurements are performed on a single point on the surface of a material with a relatively small spot size (< 0.5 mm in diameter). Measuring LIBS hyperspectral images can only be performed by scanning a raster of points. Since measurement rates up to 1 kHz can be reached, this is still a relatively fast process. Scanning systems for measuring LIBS hyperspectral images are also commercially available.
All chemical elements produce multiple emission lines or peaks that can be measured with LIBS. Some elements produce only a few peaks, while others have peaks at many different wavelengths. This is related to the number of electron orbits that an atom has on which the free electrons can fall back1. Especially for transition metals such as iron (Fe) or titanium (Ti) many of such orbits exist. This means that these elements produce lots of different emission lines in a LIBS spectrum. As an example, the figure below presents the theoretical atomic emission spectra of iron (Fe) and silicon (Si). This figure clearly shows the difference in the number of lines that these elements produce.
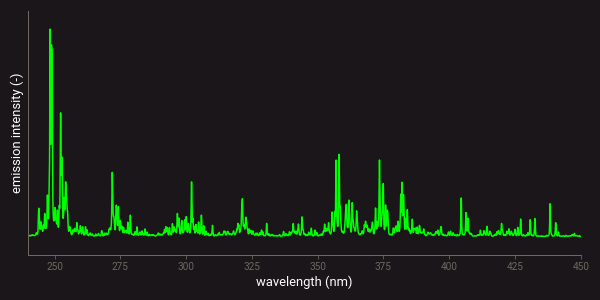
Theoretical LIBS emission lines of iron (Fe).
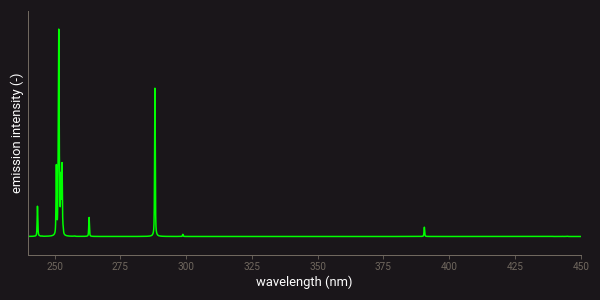
Theoretical LIBS emission lines of silicon (Si).
Contrast
The element emissions that are measured with LIBS are relatively narrow. Overlapping peaks usually occur because many elements contain a set of electron transition possibilities around very similar energy levels that produce clusters of peaks. For most elements, there are usually also a few distinct peaks with little overlap. However, when certain transition metals such as Fe occur in high quantities, they produce so many intense peaks that they can overlap and obscure those of other elements. In some cases, overlapping features can still be resolved by using a spectrometer with a higher resolution. The consequence of this is that the wavelength range that is measured needs to be reduced. This limits the detection of other elements that have emission lines outside the measured range.
Databases are available that can be used to calculate LIBS spectra for a certain material composition and set of plasma parameters. These can provide insight into the applicability of LIBS to a certain ore type and mineralogy. Examples of such databases are the NIST atomic spectra database and the Kurucz atomic spectra line database.
Detection limits
Detection limits in LIBS vary strongly between different elements. This is related to differences in the energy and transition probabilities of the electron transitions that produce the emissions1. Additionally, detection limits are affected by the wavelength position at which emission peaks of an element occur. This is because for some elements the most intense and diagnostic emission lines are in the UV spectral region, where absorption by oxygen in the atmosphere is relatively high. These lines can therefore not be detected unless the atmosphere is replaced by some noble gas such as helium or argon, which can be difficult to achieve in industrial applications. Furthermore, spectrometer sensitivity is usually not equal across all measured wavelengths. This means that optimization of the spectrometer configuration may be necessary in order to reach a certain detection limit for an element.
The LIBS-info online platform presents a summary of detection limits for all chemical elements that is based on published scientific literature. Another overview is available on the website of Devcom, which provides more details on the papers in which the detection limits are published. However, due to the large variety in lasers and spectrometers that are available to build a LIBS system, actual detection limits are usually unknown unless testing has been performed.
For mining applications it is sometimes possible to reach very low detection limits with LIBS by utilizing the small spots size and high repetition rate of the measurements. Especially when certain low-concentration elements are heterogenously distributed throughout a rock or ore, elevated concentrations may occur at the spot size of a LIBS measurement. If the LIBS measurements are being performed at random locations, spectra are occasionally measured in which such elevated concentrations produce a detectable signal. The means the detection limit can sometimes be decreased by increasing the number of collected spectra and measurement time.
Matrix effects
The influence of matrix effects in LIBS is very high. This is mainly because the intensity profile of the measured spectrum is strongly affected by the characteristics of the plasma such as temperature and electron density. These plasma characteristics rely on how well the laser energy is transferred into a plasma. This depends on how well the laser beam is focused at the surface of the material, which can be difficult to control in industrial applications. Additionally, beam angle and differences in sample density, hardness, crystallinity, grain size, and surface roughness affect the laser energy transfer3.
Apart from physical matrix effects produced by varying laser-material interactions, LIBS also suffers from chemical matrix effects. This is because the electron density of the plasma depends on the ionization energies of all the chemical elements that form it. If a certain element in a sample is replaced by one with a lower ionization energy, the electron density of the plasma is increased. These changes in electron density affect the emission behaviour of all elements. This means that a calibration to convert measured emission spectra to element concentration needs to take all compositional variability into account. Such a calibration should be based on samples from the same deposit as where the LIBS analyser is used.
Safety
LIBS analysers use high-energy lasers that can cause injury and blindness when the laser light hits someone in the eyes. Even small reflections of only a few percent of the laser light intensity is often already hazardous. As a safety measure, protective laser goggles can be worn when there is a direct line of sight to the laser beam. Alternatively, shielding along with safety interlocks can be used to close off all areas with an open beam path.
Further reading
The related books section of the RockDataAcademy provides several references to books with detailed descriptions of LIBS and its applications. Additionally, the open-access webpage of LIBS-info provides useful information on the physics behind LIBS and procedures for data analysis. Some more information on the LIBS technology is also available on wikipedia.
The webpage of Atomtrace has an articles database that can be very useful when searching for LIBS applications on specific materials or elements. Atomtrace is a company offerring LIBS instruments that provides this articles database for free. Their website also features an elements database that can be used to inspect calculated element spectra.
References
- Cremers, D. A. & Radziemski, L. J. Handbook of Laser-Induced Breakdown Spectroscopy. (John Wiley & Sons, 2013).
- Rifai, K., Doucet, F., Özcan, L. & Vidal, F. LIBS core imaging at kHz speed: Paving the way for real-time geochemical applications. Spectrochimica Acta Part B: Atomic Spectroscopy 150, 43–48 (2018).
- Harmon, R. S., Russo, R. E. & Hark, R. R. Applications of laser-induced breakdown spectroscopy for geochemical and environmental analysis: A comprehensive review. Spectrochimica Acta Part B: Atomic Spectroscopy 87, 11–26 (2013).