
The grade of mined materials is often evaluated with a resource model. This resource model is produced by mapping the geology of a deposit and performing laboratory analyses on samples that are collected through drilling. In the model, an ore deposit is often represented as a three-dimensional stack of blocks. The grade of each block is estimated by using some form of geostatistics. The size and shape of the blocks depends on the spacing of the samples, the size of geologic features, and the required precision of the block estimates. Additionally, mine engineering requirements such as bench height and equipment size often affect the chosen block size1.
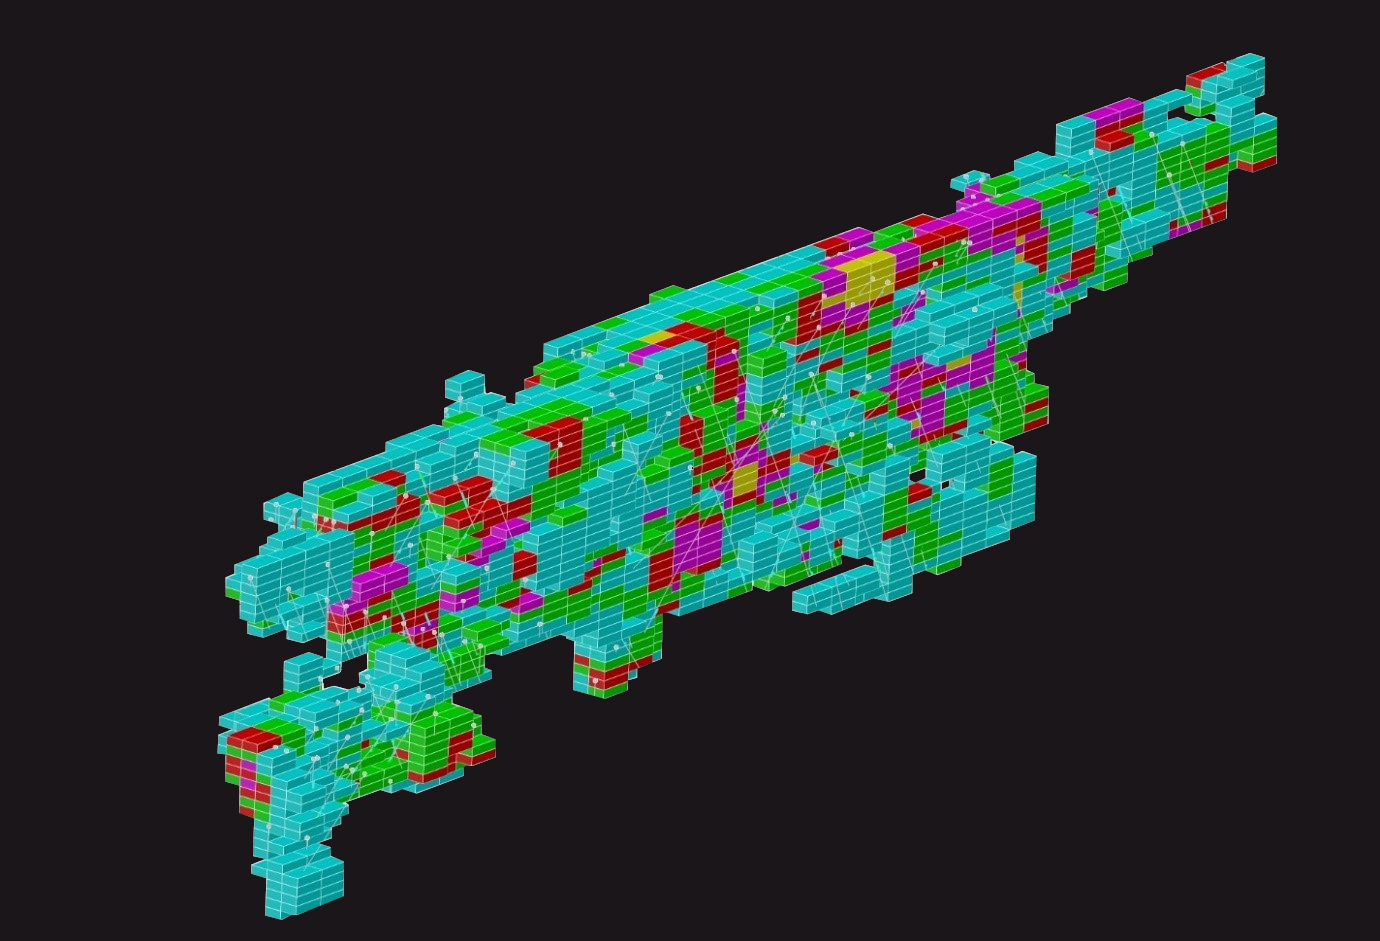
Example of a block model. The different colours of the blocks represents different ore grades. Only blocks with grades above the economic cut-off grade are shown.
A large portion of the samples that are used to create a resource model are collected during the exploration of an ore deposit. Sampling is aimed at determining the quantity and distribution of minerals that define ore value and potential mining profitability. Collecting samples is an expensive process since it often requires drilling in environments that are not easily accessible. Because of this, the number of samples is gradually increased and carefully balanced against the precision of the resource model2–4.
There is no general law on precision requirements of resource models. The precision heavily depends on the geology of the ore deposit and the number of samples used to generate the model. There are certain mining standards and codes though for reporting a deposit as a certain type of ore resource or reserve. An example of a standard that is widely used is the JORC code5.
When mining commences, a resource model is often based on (tens of) thousands of samples collected from a regular grid of drill holes at a spacing that is several tens of meters. Analyses are performed to proof that the model provides reliable estimates of the entire mineral resource, and can be used to develop a long-term mine planning. Precision of the estimates of the individual blocks of a model is low, and only averages representing at least monthly mined volumes are accurate. For many mining operations such performance is sufficient since it permits production planning and reconciliation on a monthly or quarterly basis, which meets their reporting periods to investors.
As mining progresses, resource models can be updated with production data and additional grade control samples. These grade control samples are obtained by additional drilling or by sampling cuttings from so called blast holes that are drilled for charging with explosives. Updating the model with grade control samples allows the block size to be reduced and increases model precision to permit representative estimation of daily to weekly mined volumes1. The improved model based on grade control samples is also referred to as the grade control model.
Since grade control sampling is performed while the mine is operating and required to meet certain production targets, there are strict time constraints on the collection of these samples. Additionally, the geochemical analysis of samples by laboratories is under pressure because the results need to be available as soon as excavation of the targeted blocks starts. Careful planning of grade control activities is therefore required to produce accurate estimates of ore grade.
Grade control is sometimes also performed during or after excavation by sampling of blasted ore piles, truck loads, conveyor belts, or stockpiles. In this case, ore grades cannot be estimated with a model based on grade continuity, because the spatial context of samples is usually lost. Instead, the principles of sampling theory are important for obtaining representative results for large bulk volumes6.
Considerations on data precision
For both the generation of resource models as well as the sampling of excavated bulk ore volumes, theories exist that link sampling procedures to the precision of results. For the generation of resource and grade control models, the uncertainty of block estimates can be related to the drill hole spacing and block size3,7. For resource models, it is often considered acceptable if the estimates of ore grade and tonnage are ±15% at a 90% confidence interval over a monthly or quarterly period7. This means that the copper produced at a copper mine for example should not be lower (or higher) than 15% of what is predicted by the model in 9 out of 10 months or quarters.
For grade control models, it is more common to balance the costs of misclassification of ore and waste blocks to the costs of acquiring more samples7,8. Single block misclassification rates up to 10% are accepted in this case.
The precision of ore grade information mainly depends on the sampling density and the geologic complexity of an ore deposit. The combined volume of all samples that are gathered during the life of a mine usually represents only 0.001% to 0.0001% of all the mined material2. For ore volumes in the order of quarterly or yearly productions, such a low percentage is acceptable because the drill holes from which samples are acquired are well spread throughout the volume. For smaller volumes, accurate ore grade estimations are more difficult because the distribution of drill holes is less representative. Estimations can be improved with extra data from grade control samples, which can provide representative estimations for volumes produced over one or several days.
For deposits with a high degree of geologic heterogeneity, the uncertainty of ore grade information can be relatively high for small batches such as truck loads or hourly productions. This means that when mining takes place in a zone where grades are close to the cut-off grade, misclassification of ore and waste likely takes place. Additionally, other mineralogical differences between the mined ores may be wrongfully identified, which could lower downstream processing performance.
References
- Rossi, M. E. & Deutsch, C. V. Mineral Resource Estimation. (Springer Science & Business Media, 2013).
- Sinclair, A. J. & Blackwell, G. H. Applied Mineral Inventory Estimation. (Cambridge University Press, 2006).
- Koppe, V. C., Rubio, R. H. & Costa, J. F. C. L. A chart for judging optimal sample spacing for ore grade estimation. Nat. Resour. Res. 26, 191–199 (2017).
- Drumond, D. A., Amarante, F. A. N., Koppe, V. C. & Costa, J. F. C. L. A chart for judging optimal sample spacing for ore grade estimation: Part II. Nat. Resour. Res. 29, 551–560 (2020).
- JORC. Australasian Code for Reporting of Exploration Results, Mineral Resources and Ore Reserves (Online). https://www.jorc.org (2012).
- Abzalov, M. Applied Mining Geology. vol. 12 (Springer, 2016).
- Afonseca, B. C. & Miguel-Silva, V. Defining optimal drill-hole spacing: A novel integrated analysis from exploration to ore control. J. South. Afr. Inst. Min. Metall. 122, 305–315 (2022).
- Martínez-Vargas, A. Optimizing grade-control drillhole spacing with conditional simulation. Min. Geol. 33, 1–12 (2017).