
Many sensing techniques use a spectrometer to measure the intensity of electromagnetic radiation, or light, at different wavelengths. The measured result is generally referred to as a spectrum. The figures below provide examples of a reflection and emission spectrum that were measured with a NIR-SWIR analyser and an XRF device. The NIR-SWIR reflection spectrum (left) clearly shows the mineral absorption bands that are associated with certain mineral occurrences as sharp minima. The XRF spectrum (right) shows the emissions of different elements as peaks. The intensity of each peak corresponds to the concentration of that element, and the full spectrum provides information on the elemental composition.
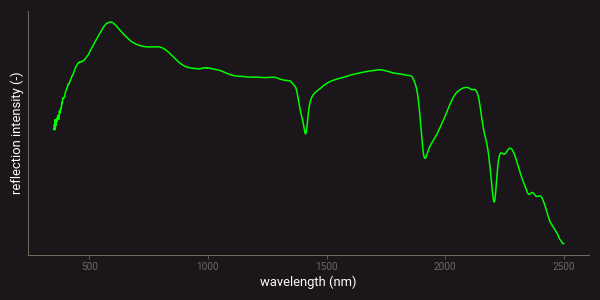
Example of a SWIR reflectance spectrum.
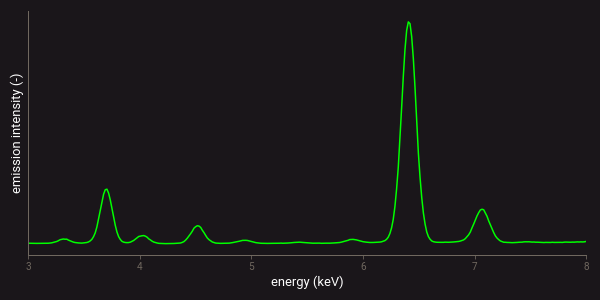
Example of an XRF emission spectrum.
Two types of spectrometry can be distinguished; point spectrometry and hyperspectral imagery. Point spectrometry is the acquisition of a spectrum over a single surface area or volume with a certain size. The area that is measured is often referred to as the spot size. Hyperspectral imagery is the measurement of digital images at many different wavelengths. Each pixel in the image contains a spectrum, which enables mapping of mineralogical or chemical information. The figure below shows an example of such mineralogical mapping on several rock particles.
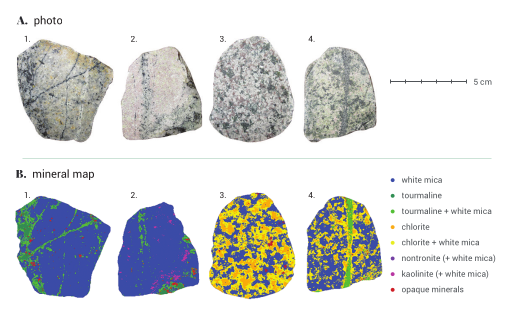
Example of mineral mapping with SWIR hyperspectral imaging.
source: PhD thesis M.Dalm (2018 – TU Delft), https://doi.org/10.4233/uuid:70a1e180-ef0c-4226-9af3-7e9dc3938c7f
Point spectrometry
Visible & infrared
Point spectra on the visible and infrared ranges of the electromagnetic spectrum can be acquired by using a dispersive spectrometer or a Fourier-transform spectrometer. Dispersive spectrometers collect spectra by first dispersing a light beam with a prism or diffraction grating. The light intensity of the different wavelengths can then be measured by rotating the prism or grating and focusing the different wavelengths one by one on a detector. Alternatively, an array of detectors can be used to measure all the different wavelengths simultaneously1.
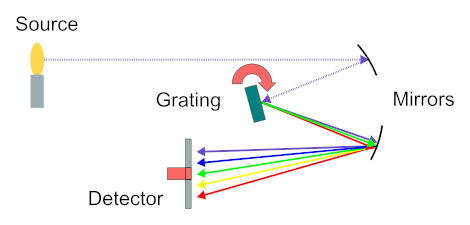
Schematic working principle of a dispersive spectrometer.
source: https://commons.wikimedia.org/wiki/File:Spectrometer_schematic.gif
It is also possible to use a 2D (image) detector in combination with two prisms or gratings that disperse the light in two perpendicular directions. Such a spectrometer configuration is referred to as an echelle spectrometer1. The advantage of this type of spectrometer is that more wavelengths can be measured at the same time. Imaging detectors that are commonly used for this type of spectrometry are charge-coupled devices (CCD) and complementary metal-oxide-semiconductors (CMOS).
Fourier-transforms spectrometers collect spectra by splitting the incoming light beam and directing both beams through a certain configuration of mirrors. The path length of one of the two beams is changed by moving one of the mirrors. Because of the different path lengths of the two beams, certain wavelengths will be extinguished when the two beams are recombined and focused on a detector2. This means that the wavelengths that are measured changes with the position of the mirror. The measured light intensity versus mirror position is commonly referred to as an interferogram. A signal processing technique known as the Fourier-transform is used to transform the interferogram into a spectrum of intensity versus wavelength2.
Detecting light intensity is generally performed with an electronic device that transforms the incoming photons into an electric current. A higher light intensity (i.e. more photons) produces a higher current. The spectrum is recorded by measuring these currents and transforming them to reflection, absorption or emission intensity. Such a transformation is usually based on measurement of a reference material or standard of which the properties are known.
Different types of detectors are available for the different wavelength regions of the electromagnetic spectrum. This is mainly because the physical processes that can be used to transfer light intensity into an electric current are limited to a certain wavelength range. The table below summarizes the detector types that are commonly used for visible and infrared spectroscopy.
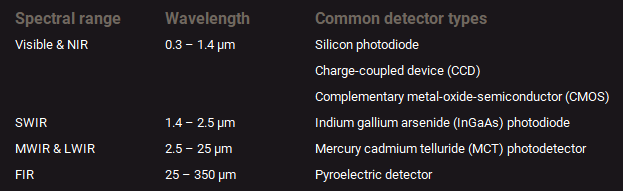
Detector types commonly used for measuring the different spectral regions.
X-ray & gamma-ray
Measuring spectra on the x-ray region of the electromagnetic spectrum can be done by using an energy-dispersive or wavelength-dispersive spectrometer. An energy-dispersive spectrometer utilizes a detector that can detect both the amount and energy of the incoming photons. This means that separating the different wavelengths and measuring the intensity is performed with one electronic component. A detector type that is commonly used for this is a silicon drift detector (SDD).
A wavelength-dispersive x-ray spectrometer is similar to the ones used in visible spectroscopy. The main difference is that the incoming beam is not dispersed with a prism or grating, but with a specific type of crystal or synthetic multilayer3. Detection of the x-ray intensity is usually performed with a scintillation counter. This is a device that converts the x-rays to visible light by using a scintillation material. The light intensity is subsequently measured by using a photomultiplier or some other visible light detector3.
The advantage of wavelength-dispersive XRF (WD-XRF) over energy-dispersive XRF (ED-XRF) is that a higher spectral resolution can be achieved and light elements can be more accurately measured (down to Be). The disadvantage is that WD-XRF systems are usually more complex and require a higher energy x-ray source3.
Scintillation counters are also used to measure gamma-ray (γ-ray) spectra. In this case, a specific type of scintillator material is used that is directly coupled to photomultipliers in order to measure both the wavelength and intensity of the incoming gamma-rays4.
Finally, gamma-ray spectra can also be measured with solid state detectors. These are composed of a semiconductor material in which a charge is created when it is exposed to the gamma-rays4. Solid state gamma-ray detectors provide a higher spectral resolution than scintillation counters, but require cooling with liquid nitrogen to operate.
Hyperspectral imaging
Hyperspectral images can be acquired by using a point spectrometer to take measurements over a raster of points. In reflectance spectroscopy it is more common though to use a line scan sensor for this. A line scan sensor utilizes an image detector to simultaneously record spectral information at multiple positions over the line. These multiple positions are recorded on the pixels along one direction of the 2D image detector. The resolution or pixel size of the measurements depends on the number of pixels on the detector and the length of the line that is measured by the line scan.
The different wavelengths are measured along the other direction of the image detector. This is achieved by dispersing the light from the line with a prism or grating. The spectral resolution depends on the number of pixels on the detector and the wavelength range that is measured by the line scan.
A hyperspectral image is created by taking multiple measurements while moving an object through the line scan. The speed at which the object is moved and the measurement speed of the line scan determines the pixel size of the hyperspectral image in the direction perpendicular to the scan line. In most cases, this speed is set to obtain images of which the pixels are more or less square.
The concept of a line scan camera is clearly explained in this video by Specim.
Spectrometer characteristics
The capabilities of spectrometers and hyperspectral imagers are usually described in terms of spectral range, spectral resolution, and signal-to-noise ratio. The spectral range is the wavelength range over which measurements are performed. The table of detector types presented above already showed wavelength regions that are commonly distinguished.
The spectral resolution is the smallest wavelength difference that can be distinguished with a spectrometer. It affects how well certain material properties can be detected. This is especially the case when absorption or emission features of different elements or minerals overlap each other, since the spectral resolution determines how well the overlapping features can be resolved or unmixed.
For most spectrometers, the spectral resolution is best described in terms of bandwidth and spectral sampling5. Bandwidth is the wavelength range that is measured by each individual channel of a detector array, and the spectral sampling is the wavelength distance between the individual channels. The spectral sampling determines the number of data points that are recorded by the spectrometer. The bandwidth is a measure of the quality of each data point.
The signal-to-noise ratio (SNR) is the ratio between the measured signal intensity and the instrumental noise produced by the electronics of the detection mechanism. A higher SNR means that the signal is more stable and the measurement more reliable. Since random noise reduces when averaging multiple measurements, the SNR determines the measurement time that is required to collect data of a certain quality.
Further reading
The related books section of the RockDataAcademy provides several references to books containing more detailed information on the principles and applications of spectrometry. The chapter on spectroscopy within open-access library of Libretexts chemistry also provides a good introduction to all different aspects of spectroscopy. Access to this library is free.
The following wikipedia articles are also useful sources of information:
- Optical spectrometer
- Fourier-transform spectroscopy
- Energy-dispersive X-ray spectroscopy
- Wavelength-dispersive X-ray spectroscopy
- Gamma spectroscopy
References
- Vitha, M. F. Spectroscopy: Principles and Instrumentation. (John Wiley & Sons, 2018).
- Griffiths, P. R. & De Haseth, J. A. Fourier Transform Infrared Spectrometry. (Wiley, New York [etc.] :, 1986).
- Beckhoff, B., Kanngießer, B., Langhoff, N., Wedell, R. & Wolff, H. Handbook of Practical X-Ray Fluorescence Analysis. (Springer Science & Business Media, 2007).
- Gilmore, G. Practical Gamma-Ray Spectroscopy. (John Wiley & Sons, 2008).
- Clark, R. N. Spectroscopy of rocks and minerals, and principles of spectroscopy. Man. Remote Sens. 3, 3–58 (1999).